
Skip to contentWhat Is the Best New Energy Car Production Line in 2026? The answer is not simply the line with the fastest robots. It is the one that builds safe, reliable vehicles at a competitive cost, while adapting to changing battery designs and customer demand. The International Energy Agency’s Global EV Outlook 2025 reports that electric car sales exceeded 17 million in 2024 and could top 20 million in 2025. That growth raises the stakes for every factory decision, from battery-pack assembly to end-of-line testing.
A useful principle comes from Tesla CEO Elon Musk, who has described manufacturing with the phrase, “The factory is the product.” For a New Energy Car Production Line, that idea means evaluating the whole system, not just individual machines. Look closely at automation, material flow, battery traceability, quality checks, worker ergonomics, and the time needed to change models. A robotic cell may look impressive under bright factory lights. But its value falls quickly if it creates bottlenecks or requires costly downtime.
There is no universal winner. A high-volume plant and a flexible regional facility may need very different designs. IEA sales figures show market momentum, but they do not tell buyers which layout will deliver the best results at a specific site. That judgment requires verified capacity targets, product plans, labor conditions, and supplier data. Some comparisons remain imperfect; public figures rarely reveal real-world yield or maintenance costs. The sections ahead examine the criteria that matter most, and where a “best” line can still fall short.
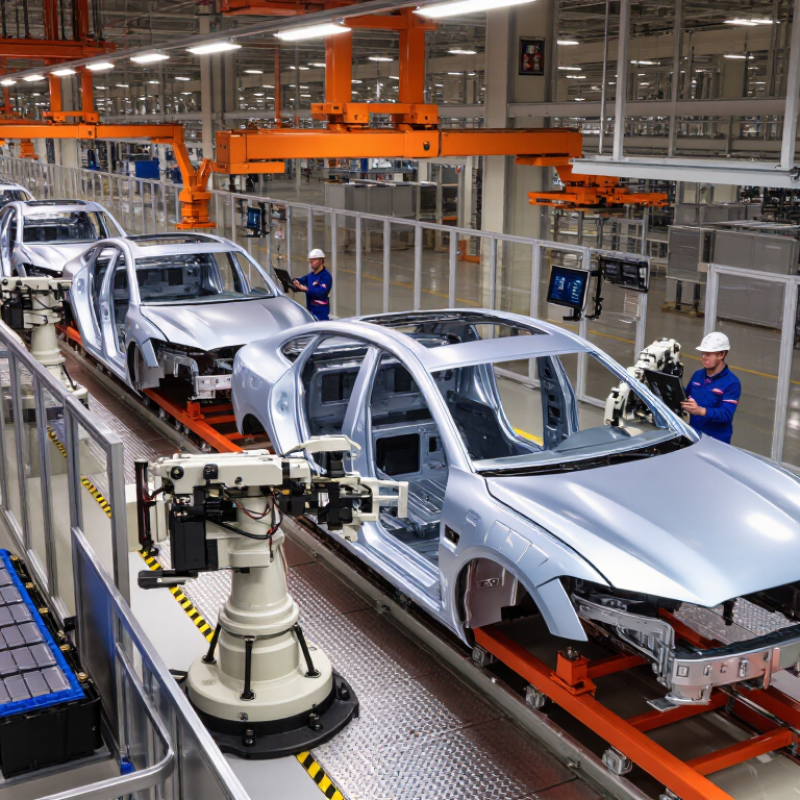
A new-energy vehicle production line in 2026 is defined by how reliably it connects battery, power electronics, software, and final assembly. It must handle changing vehicle designs without costly downtime. The International Energy Agency’s Global EV Outlook 2024 reports nearly 14 million electric cars sold in 2023, about 18% of global car sales. That scale makes repeatable quality and adaptable capacity essential, not optional.
Look beyond robot counts. A capable line records battery-pack test results, monitors torque at fastening stations, and flags paint or weld defects before final inspection. It also links production data to maintenance teams, so a small equipment fault does not stop an entire shift. The IEA projected electric-car sales would approach 17 million in 2024; demand growth makes flexible scheduling valuable. Still, automation alone is not proof of efficiency. A highly automated line can waste energy or create bottlenecks. Some factories will need better process design before more robots.
Tips: Ask for measured uptime, first-pass yield, and energy use per vehicle. Check whether battery tests are traceable to each finished vehicle. Walk the line during a model change. Watch for delays.
A high-performing new energy car production line is not defined by speed alone. Its performance depends on how reliably each stage hands work to the next. Battery modules need careful handling, accurate joining, and electrical isolation checks. A few millimeters of misalignment can cause rework later. Details matter. Body assembly must hold tight dimensional tolerances, while motor and inverter stations need repeatable fastening and clean connections.
Material flow shapes daily output. If battery packs arrive late, final assembly may sit idle, even when other stations run quickly. Balanced line takt, clear part tracking, and well-planned changeovers reduce these gaps. Sensors can flag torque or temperature readings outside approved limits, but operators still need practical training to respond. Technology helps. It does not replace judgment.
End-of-line testing should cover charging, braking, software functions, and road-simulated operation. A consistent test record helps teams trace defects back to a station instead of guessing. Energy use and equipment uptime matter, too; compressed air leaks and frequent stoppages quietly erode efficiency. There is no perfect layout. A line optimized for one vehicle configuration may struggle when designs change, so flexibility deserves attention before expansion. Teams should review real fault data regularly, even when it challenges their original assumptions.
How manufacturing stages shape production-line performance
How to read this: This illustrative line-balancing scenario compares station cycle-time targets, not measured industry averages. The slowest unbuffered station can constrain line output; parallel stations, buffers, and well-coordinated battery-pack installation and end-of-line testing can help reduce bottlenecks. Actual targets depend on vehicle design, factory layout, and production volume.
A strong new-energy car production line is not simply the one with the most robots. Its advantage comes from connecting automation with reliable production data. Robots can handle repetitive welding and lifting, while machine vision checks weld seams and battery-pack alignment. Digital work instructions can guide operators through different vehicle configurations without stopping the line. Small gains matter. Deloitte and MAPI’s 2024 Smart Manufacturing Survey found that 86% of manufacturing executives expect smart manufacturing solutions to drive competitiveness over the next five years.
That expectation has practical roots. The International Federation of Robotics reported 4.28 million industrial robots operating worldwide in 2023, a 10% increase from 2022. On a vehicle line, sensors can flag a torque deviation before a battery module moves to the next station. Production software can also connect downtime, quality checks, and material flow, helping teams locate recurring bottlenecks. Yet software cannot fix poor process design. A dashboard may show rising output while operators are still clearing false alarms or waiting for parts. Digital twins can test layout changes before equipment is moved, but their results depend on accurate data. In practice, even a well-connected line needs regular checks on sensor quality and worker feedback.
The best production line is not simply the fastest one. It must match a factory’s vehicle mix, output targets, available floor space, and workforce skills. Start with the planned battery, motor, and vehicle assembly processes. Check whether stations can handle product changes without lengthy retooling. Throughput matters, but only when quality stays consistent across shifts.
Walk the proposed process from material delivery to final inspection. Look for clear movement paths, safe lifting points, and space to service equipment. Inspect how battery packs are handled, tested, and traced through production. Ask for cycle-time data from comparable operating conditions, not just ideal demonstrations. Small stoppages add up.
Energy use and maintenance needs also shape long-term value. Review estimates for electricity, compressed air, spare parts, and technician training. Confirm that inspection systems can detect defects early and record useful production data. Demand may change. Perfect forecasts are rare. A little spare capacity can help, though too much may leave expensive equipment idle. Factories should compare the full operating plan against their own staffing, utility costs, and expected production schedule.
Compare line configurations against factory requirements. The best choice depends on the production plan, vehicle mix, available space, labor, and investment limits—not on one universal ranking.
| Selection Criterion | What to Measure | High-Volume Dedicated Line | Flexible Mixed-Model Line | Modular or Cell-Based Line | Best-Fit Signal |
|---|---|---|---|---|---|
| Annual production volume | Planned good vehicles per year, by model and shift pattern | Strong fit when one platform has stable, sustained demand | Useful when demand is substantial but spread across several models | Useful for staged launches, lower initial volume, or incremental capacity additions | Choose a configuration that meets the forecast without relying on permanent maximum utilization. |
| Required takt time | Available production time ÷ required good units; calculate separately for each constrained process | Designed around a consistent, repeatable cycle | Must accommodate the cycle-time differences between models | Capacity can be added by adding or duplicating work cells | For illustration, 4,000 scheduled hours per year and 50,000 units require an average takt of 288 seconds per unit before allowances for breaks, downtime, and losses. |
| Model and platform mix | Number of body styles, wheelbases, battery configurations, and option combinations | Best when product variation is limited and the product plan is stable | Best when multiple compatible models must share equipment | Best when processes can be separated into independently configured modules | Confirm that all intended variants fit the equipment, fixtures, and material-flow design. |
| Changeover requirements | Changeover time, tooling changes, software settings, and verification steps | May need dedicated tooling or planned model-specific production windows | Requires validated changeover procedures and model identification at each station | Can isolate some changes to a module, depending on process integration | Use measured trials and supplier cycle-time studies; do not assume changeover is instantaneous. |
| Equipment utilization and availability | Overall equipment effectiveness (OEE), downtime, speed loss, and first-pass yield | High utilization can support strong output but makes bottlenecks especially important | Model mix and routing can affect utilization and line balance | Local disruptions may be contained, subject to buffers and routing design | Set site-specific targets and define OEE consistently; OEE is availability × performance × quality. |
| Battery-pack handling and safety | Pack mass and dimensions, lift method, isolation checks, fire detection, and emergency response | Can support dedicated, standardized pack installation and test stations | Needs flexible fixtures and verified procedures for each supported pack variant | Can place pack assembly or testing in a separate controlled module | Require a documented risk assessment, safe lifting design, electrical-safety controls, and applicable local-code compliance. |
| Quality and end-of-line testing | First-pass yield, defect escape rate, torque records, leak tests, and electrical checks | Repeatable stations can simplify process control for a stable product | Requires recipe control and clear variant verification at each relevant station | Testing modules can be expanded or reconfigured as product requirements change | Define required tests, acceptance limits, and rework routes before finalizing the line layout. |
| Traceability and data integration | Vehicle identification, component genealogy, process results, and data-retention needs | Can collect consistent station-level data for a standardized flow | Needs reliable model- and option-specific routing and process parameters | Needs consistent data interfaces across modules and stations | Verify that each critical operation can be linked to the finished vehicle record. |
| Labor and automation strategy | Staffing by shift, ergonomic exposure, automation level, and maintenance skills | Automation may be economical for repetitive, high-volume tasks | Automation must tolerate model variation and changeover needs | Can support selective automation and phased staffing changes | Automate where repeatability, safety, quality, or lifecycle cost justifies it—not simply to maximize robot count. |
| Footprint and material flow | Floor area, aisle access, buffer space, inbound routes, and finished-vehicle flow | Often benefits from a continuous, carefully balanced flow | Needs space for variant-specific parts and flexible logistics routes | Requires room for module access, separation, and possible future additions | Validate the layout with equipment envelopes, maintenance access, safety clearances, and material-flow simulations. |
| Investment and lifecycle cost | Total installed cost, tooling, utilities, training, maintenance, and cost per good vehicle | Investment can be easier to justify at consistently high volume | May reduce the need for separate lines but can require more complex changeover capability | Can support phased investment; integration and duplicated equipment still need evaluation | Compare total cost over the planned product life, including ramp-up, model changes, and downtime. |
| Expansion and product changes | Time, cost, and disruption needed to add shifts, models, stations, or capacity | Expansion may require substantial rebalancing or additional dedicated equipment | Can accommodate compatible models if capacity and routing were designed for them | Well suited to incremental capacity or process changes where interfaces are standardized | Ask for a documented expansion scenario with space, utility, staffing, and shutdown assumptions. |
| Commissioning and ramp-up | Installation schedule, process validation, trial builds, and time to stable good output | Requires coordinated commissioning of a tightly connected flow | Variant validation adds planning and verification work | Modules may be commissioned in stages if interfaces allow independent operation | Include trial production, safety validation, operator training, and corrective-action time in the project plan. |
Planning note: The takt-time example is a calculation, not a production guarantee. Actual capacity depends on net available time, breaks, maintenance, changeovers, bottlenecks, product mix, and good-unit yield. Validate all targets with a factory-specific process study and applicable safety requirements.
The best new-energy-car production line in 2026 is not one universal layout. It should match vehicle size, battery design, and planned output. Compact cars often suit flexible mixed-model lines, where adjustable fixtures handle different body widths. A shorter wheelbase may save floor space, but battery installation still needs precise alignment and controlled lifting. Small errors matter.
Electric SUVs need lifting equipment and conveyors designed for heavier battery packs. Their lines also benefit from clear inspection points for fasteners, electrical connections, and sealing. Commercial vans may need modular stations because chassis lengths and payload requirements vary. A highly automated line can look efficient on paper, yet frequent model changes may disrupt it. That assumption deserves a second look. Human operators remain valuable for exception handling, though training takes time.
Tips: Match automation to repeatable tasks. Leave room for battery checks, maintenance access, and future model changes. Track cycle time and defect data during pilot runs. Revise the layout when real production exposes a weak point.
